A massive part of the project is organizing all of the collected readings and visualizing it. That is what Soracom Harvest and Lagoon are perfect for. Since the chosen SIM for H2OSupport is provided by Soracom, it is very easy to connect and setup these two pieces of software.
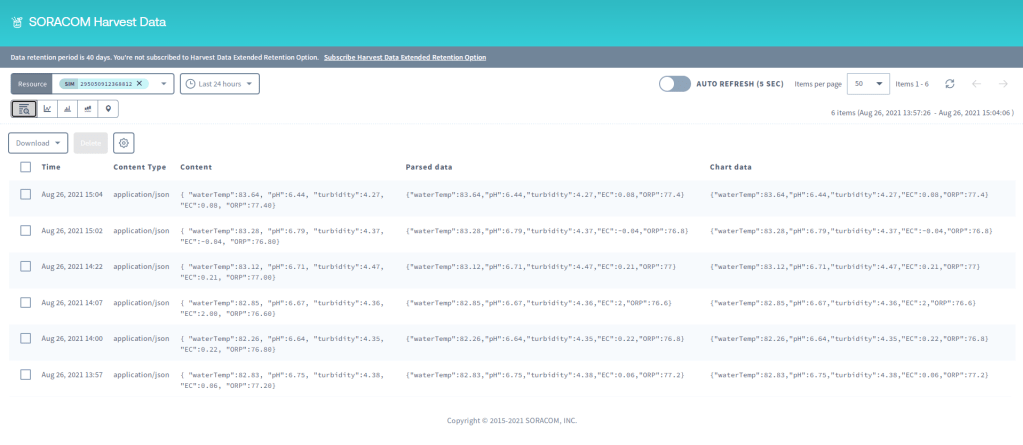
Soracom Harvest is a platform which can receive data from a cellular network that is parsed within a JSON string and strip it to store its useful content. For H2OSupport, the readings are parsed and the content is presented in Soracom Harvest’s console.
Soracom Lagoon is a data visualization platform that takes the content from Soracom Harvest and displays it for an easier grasp of tendencies in data analysis. It allows us to setup different dashboards and panels to our liking. This makes it very easy to monitor each reading or multiple readings. A user would simply go to their Soracom Lagoon dashboard and have all the required info for water quality monitoring right in front of them.

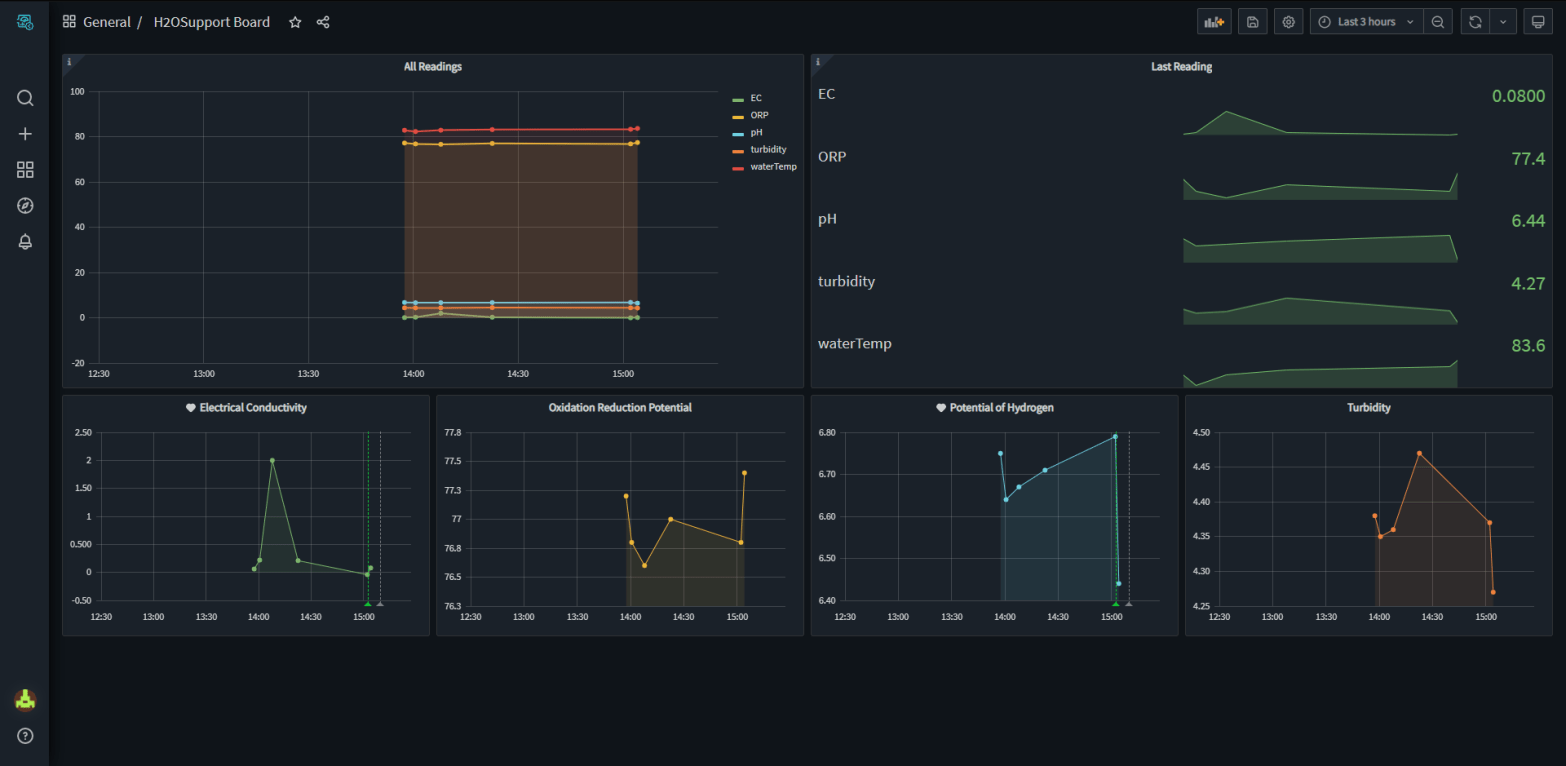
For H2OSupport, I have a chart with all the readings (EC, ORP, pH, turbidity and water temperature) in order according to which time they were taken at. This chart will be useful to determine tendencies in these water quality values. The horizontal charts on the right to it show tendencies of each water quality value, along with the last value recorded. This way, it is easy to view the last readings recorded at a glance.
The four bottom charts allow us to see the different water quality value tendencies with more precision. The EC and pH charts also have thresholds attached to them that constantly monitor the values and send alerts whenever these values are unusual. I decided to only set thresholds for these two water quality values, because the others can be very subjective. It is not a single value that will dictate if the water is unhealthy, it is often a combination of multiple. Like with Soracom Harvest, this is entirely customizable.
The first threshold will alert the user if the EC value rises above 1000 uS/cm. The second will alert the user if the pH value drops below 6.0 or rises above 8.5. These are typical tested numbers of a healthy body of water.
